


🏘️
Socioeconomic Profile
Census 202197,592
Population
$73,000
Median Income
11.8%
Unemployment
72.6%
Homeownership
👥 Population
46
Median Age
1.5%
Growth (2016–2021)
💰 Income
$83,000
Median Household Income
$102,800
Average Household Income
9.9%
Low Income Prevalence (LIM-AT)
💼 Labour
55.6%
Participation Rate
49.1%
Employment Rate
11.8%
Unemployment Rate
🎓 Education (25–64)
No Certificate
11,095
High School
24,775
Postsecondary
45,580
Bachelor's+
13,550
🏠 Housing
$454,400
Avg. Dwelling Value
$1,081
Avg. Monthly Rent
$1,157
Avg. Mortgage Cost
🌍 Diversity
6,450
Visible Minorities
10,080
Immigrants
4,285
Indigenous Identity
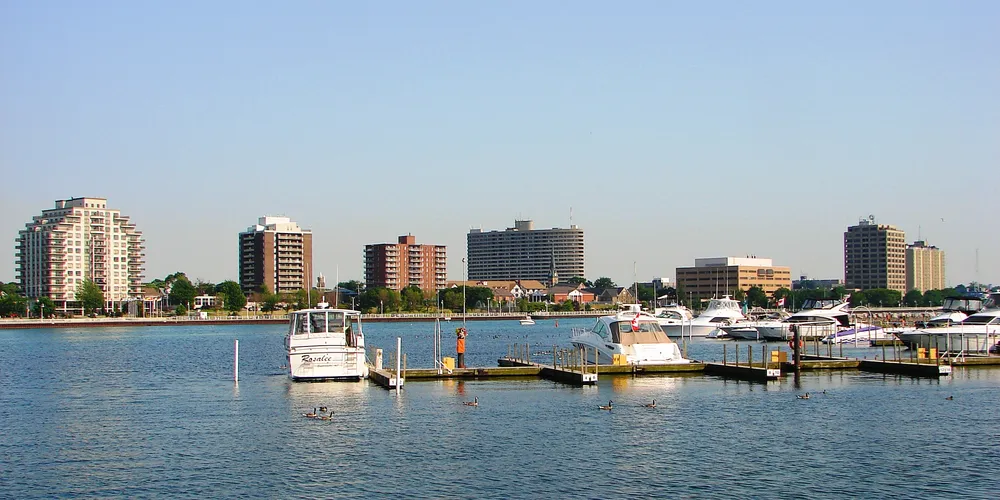
According to the 2021 Census, Sarnia had a population of 97,592 (+1.5% change from 2016) with a median age of 46.0. The median after-tax household income was $73,000, and the unemployment rate was 11.8%. Homeownership rate was 72.6% with an average dwelling value of $454,400.
Source: Statistics Canada, Census of Population, 2021