Crime Canada

Latest

  • Front page
  • All news
  • Data and insights

News by province

  • British Columbia
  • Alberta
  • Saskatchewan
  • Manitoba
  • Ontario
  • Quebec
  • New Brunswick
  • Nova Scotia
  • Prince Edward Island
  • Newfoundland and Labrador
  • Yukon
  • Northwest Territories
  • Nunavut

Police appeals

  • All alerts
  • Missing persons
  • Wanted persons

Explore the data

  • Statistics dashboard
  • Canada overview
  • Crime rate by province
  • Compare cities
  • Metro areas
  • Police areas
  • Crime map

Rankings and reports

  • Safest cities
  • Most dangerous cities
  • Crime Severity Index
  • Crime trends
  • Biggest changes this year
  • Property vs violent crime
  • Is Canada safe?
  • Methodology and sources

By province

  • British Columbia
  • Alberta
  • Saskatchewan
  • Manitoba
  • Ontario
  • Quebec
  • New Brunswick
  • Nova Scotia
  • Prince Edward Island
  • Newfoundland and Labrador
  • Yukon
  • Northwest Territories
  • Nunavut

Know your options

  • Free consultation
  • Find a criminal lawyer
  • Offence guides
  • Your rights and the courts
  • Find your court date
  • Bail, records and pardons
  • Jails and prisons
  • Understanding crime data
Get helpFree consultation
Language
News

Latest

  • Front page
  • All news
  • Data and insights

News by province

  • British Columbia
  • Alberta
  • Saskatchewan
  • Manitoba
  • Ontario
  • Quebec
  • New Brunswick
  • Nova Scotia
  • Prince Edward Island
  • Newfoundland and Labrador
  • Yukon
  • Northwest Territories
  • Nunavut
Alerts

Police appeals

  • All alerts
  • Missing persons
  • Wanted persons
Crime statistics

Explore the data

  • Statistics dashboard
  • Canada overview
  • Crime rate by province
  • Compare cities
  • Metro areas
  • Police areas
  • Crime map

Rankings and reports

  • Safest cities
  • Most dangerous cities
  • Crime Severity Index
  • Crime trends
  • Biggest changes this year
  • Property vs violent crime
  • Is Canada safe?
  • Methodology and sources

By province

  • British Columbia
  • Alberta
  • Saskatchewan
  • Manitoba
  • Ontario
  • Quebec
  • New Brunswick
  • Nova Scotia
  • Prince Edward Island
  • Newfoundland and Labrador
  • Yukon
  • Northwest Territories
  • Nunavut
Legal help

Know your options

  • Free consultation
  • Find a criminal lawyer
  • Offence guides
  • Your rights and the courts
  • Find your court date
  • Bail, records and pardons
  • Jails and prisons
  • Understanding crime data
Free legal consultation
Crime CanadaStatistics DashboardPolice AreasMetro AreasLearn
  1. Home
  2. /Canada
  3. /Northwest Territories
  4. /Inuvik

Town · Northwest Territories

Inuvik crime statistics

Crime data for Inuvik, Northwest Territories.

Updated October 26, 2026·Data year 2025·Source: Statistics Canada, police-reported crime·Français

These figures are for the Inuvik RCMP detachment, which polices Inuvik and the rural area around it.

Inuvik crime statistics, 2025

Key takeaway

In 2025, police reported 2,895 incidents in Inuvik, −6.5% from 2024. Police cleared 23.2% of incidents.

Police service reporting these figures: Inuvik, Northwest Territories, Royal Canadian Mounted Police, rural

Police-reported incidents

2,895

↓ −6.5% vs previous year

Source: Statistics Canada, Table 35-10-0185-01, 2025

How to read this

Incidents cleared

23.2%

Source: Statistics Canada, Table 35-10-0185-01, 2025

How to read this

Crime Severity Index, Canada

75.0

Source: Statistics Canada, Table 35-10-0026-01, 2025

How to read this

Police-reported incidents in Inuvik, 2010 to 2025

All violations: Criminal Code, traffic and other federal laws.

01,0002,0003,0004,000201020142018202220252,895
  • Inuvik
01,0002,0003,0004,000201020132016201920222025Inuvik 2,895
Source: Statistics Canada, Table 35-10-0185-01
Show the dataHide the data
Police-reported incidents in Inuvik, 2010 to 2025
YearIncidents
20103,452
20113,360
20122,989
20132,269
20142,110
20151,887
20161,700
20171,948
20182,277
20193,252
20203,178
20212,857
20222,400
20232,936
20243,096
20252,895
Download CSV
Embed this chart

Most reported offences in Inuvik, 2025

  • Mischief1,309
  • Disturb the peace514
  • Assault, level 1340
  • Theft $5,000 or under80
  • Fail to comply with order80
  • Operation while impaired (alcohol)76
  • Uttering threats70
  • Cocaine, trafficking67
  • Assault, level 2, weapon or bodily harm53
  • Sexual assault, level 130
Source: Statistics Canada, Table 35-10-0185-01, 2025
Show the dataHide the data
Most reported offences in Inuvik, 2025
OffenceIncidents
Mischief1,309
Disturb the peace514
Assault, level 1340
Theft $5,000 or under80
Fail to comply with order80
Operation while impaired (alcohol)76
Uttering threats70
Cocaine, trafficking67
Assault, level 2, weapon or bodily harm53
Sexual assault, level 130
Download CSV

Types of crime in Inuvik, 2025

Share of Criminal Code incidents, excluding traffic.

  • Property crime54.3 %
  • Other Criminal Code25.3 %
  • Violent crime20.4 %
Source: Statistics Canada, Table 35-10-0185-01, 2025
Show the dataHide the data
Types of crime in Inuvik, 2025
TypeIncidents%
Property crime1,47854.3
Other Criminal Code68925.3
Violent crime55520.4
Download CSV

Every reported offence

The most reported offences in Inuvik, 2010 to 2025

Police-reported incidents per year.

05001,0001,500201020142018202220251,30951434080
  • Mischief
  • Disturb the peace
  • Assault, level 1
  • Theft $5,000 or under
05001,0001,500201020132016201920222025Mischief 1,309Disturb the peace 514Assault, level 1 340Theft $5,000 or under 80
Source: Statistics Canada, Table 35-10-0177-01
Show the dataHide the data
The most reported offences in Inuvik, 2010 to 2025
YearMischiefDisturb the peaceAssault, level 1Theft $5,000 or under
20101,3381,04521486
20111,4541,00718281
20121,38081818577
201391566614579
201481861916257
201571144416949
201666332315274
201767844321870
201889657521945
20191,38271330884
20201,35661331970
20211,19755232078
20221,12533328268
20231,21252530487
20241,238573329117
20251,30951434080
Download CSV

Historical Trend by Violation

Charged or under investigation?

Talk to a criminal defence lawyer before you speak to police. Tell us what happened and an independent lawyer will contact you. The first consultation is free and confidential.

Prefer to call? +1 778 900 3008

Crime Canada is not a law firm. We pass your request to an independent criminal defence lawyer, who contacts you directly. General information, not legal advice. How this works

Charged with a crime in Inuvik?

Local court process, penalties and how to reach a criminal defence lawyer in Northwest Territories.

  • Criminal defence lawyer in Northwest Territories→
  • Impaired driving (DUI) lawyer in Northwest Territories→
  • Assault lawyer in Northwest Territories→
  • Domestic assault lawyer in Northwest Territories→

More detail

  • Police and justice
  • Violent crime
  • Property crime
  • Fraud and cybercrime
  • Drugs, weapons and driving
  • Community profile

Police and justice

Crimes solved and people charged

Crimes solved by police

Share of reported incidents cleared by a charge or otherwise, 2025.

23%
of all incidents solved
4.6%
of reports unfounded

Solved, by type of crime

  • Violent crime32%180 / 555
  • Property crime20%291 / 1,478
  • Other offences26%176 / 689
Police found 139 of 3,034 reports to be unfounded: no crime happened or was attempted.

Source: Statistics Canada, Tables 35-10-0026-01 and 35-10-0185-01, 2025

DataHide data
Crimes solved by police
TypeIncidentsSolvedSolved (%)
All2,89567223.2
Violent55518032.4
Property1,47829119.7
Other68917625.5
CSVHow to read

People charged

Adults and youth (12 to 17) charged, 2010 to 2025.

171
adults charged, 2025
10
youth charged
44%
of youth dealt with without a charge
02040602010201420182022202510
020406020102013201620192022202510
Charges against youth fell 80% since 2010. Youth not charged were dealt with by warnings, cautions or referrals to programs.

Source: Statistics Canada, Table 35-10-0185-01

DataHide data
People charged
YearAdults chargedYouth charged
202517110
20242745
20231879
20221678
202121910
202037110
20193173
20182658
201727118
201625229
201530616
201423434
201322220
201223523
201131225
201040250
CSVHow to read

Violent crime

Assaults, sexual offences, homicide, hate crimes

Violent crime

Rate per 100,000 people, 2010 to 2025.

555
incidents, 2025
16,632
per 100,000
↓ 6.9%
vs 2024
05,00010K15K20K2010201420182022202517K1,443
05,00010K15K20K20102013201620192022202517K1,443
  • Inuvik
  • Canada

Share of incidents, 2025

  • Assault, level 134061%
  • Uttering threats7013%
  • Assault, level 25310%
  • Sexual assault, level 1305%
  • Criminal harassment92%
  • Other violent offences489%
The rate in Inuvik is 12 times the Canada rate (1,443); Northwest Territories: 11,630.

Source: Statistics Canada, Table 35-10-0185-01, 2025

DataHide data
Violent crime
YearIncidentsRate per 100,000Canada rate
202555516,631.71,443.3
202459317,861.51,447.8
202352115,816.61,441.8
202248514,564.61,376.9
202155116,345.31,331.1
202061418,085.41,265.0
201954515,847.61,278.5
201838811,200.91,151.4
201735210,244.51,112.7
20162948,581.41,076.0
20153078,826.91,070.3
20142808,006.91,044.2
20132577,447.11,095.7
20123319,549.91,198.8
201137210,333.31,235.7
201045812,558.31,291.6
CSVHow to readAssault: law and penalties →

Sexual offences

Rate per 100,000 people, 2010 to 2025.

42
incidents, 2025
1,259
per 100,000
↓ 14.7%
vs 2024
05001,0001,500201020142018202220251,259133
05001,0001,5002010201320162019202220251,259133
  • Inuvik
  • Canada

Share of incidents, 2025

  • Sexual assault, level 13071%
  • Offences against children921%
  • Intimate images shared25%
  • Sexual assault, level 212%
The rate in Inuvik is 9.4 times the Canada rate (133); Northwest Territories: 688.

Source: Statistics Canada, Table 35-10-0185-01, 2025

DataHide data
Sexual offences
YearIncidentsRate per 100,000Canada rate
2025421,258.6133.4
2024491,475.9134.9
202324728.6133.3
202233991.0134.2
202132949.3132.6
2020481,413.9113.1
2019351,017.7118.5
201833952.7107.7
201729844.097.0
201615437.884.4
201517488.876.6
201417486.173.1
201320579.674.4
20129259.776.2
201120555.676.5
201019521.077.9
CSVHow to readSexual assault: the law →

Property crime

Theft, break-ins, vehicles, mischief

Property crime

Rate per 100,000 people, 2010 to 2025.

1,478
incidents, 2025
44,291
per 100,000
↑ 1.1%
vs 2024
020K40K60K2010201420182022202544K3,141
020K40K60K20102013201620192022202544K3,141
  • Inuvik
  • Canada

Share of incidents, 2025

  • Mischief1,30989%
  • Theft under $5,000997%
  • Break and enter272%
  • Fraud and other211%
The rate in Inuvik is 14 times the Canada rate (3,141); Northwest Territories: 27,367.

Source: Statistics Canada, Table 35-10-0185-01, 2025

DataHide data
Property crime
YearIncidentsRate per 100,000Canada rate
20251,47844,291.33,140.6
20241,45543,825.33,264.6
20231,40442,623.03,409.6
20221,27138,168.23,325.0
20211,34439,869.53,052.5
20201,49343,976.43,084.8
20191,55645,245.73,509.4
20181,03029,734.43,347.7
201785824,970.93,265.3
201683624,401.63,238.5
201586924,985.63,231.4
201497827,966.83,099.5
20131,12132,483.33,154.0
20121,59846,105.03,438.4
20111,68446,777.83,536.2
20101,60443,981.43,838.1
CSVHow to readTheft: law and penalties →

Break and enter

Rate per 100,000 people, 2010 to 2025.

27
incidents, 2025
809
per 100,000
01,0002,0003,00020102014201820222025809264
01,0002,0003,000201020132016201920222025809264
  • Inuvik
  • Canada
The rate in Inuvik is 3.1 times the Canada rate (264); Northwest Territories: 1,023.

Source: Statistics Canada, Table 35-10-0185-01, 2025

DataHide data
Break and enter
YearIncidentsRate per 100,000Canada rate
202527809.1263.5
202429873.5294.6
2023341,032.2327.8
202229870.9342.4
202121623.0329.3
202022648.0363.1
201928814.2429.4
2018381,097432.5
2017531,542.5436.8
201632934.0443.7
2015431,236.3447.1
2014531,515.6429.4
2013561,622.7446
2012661,904.2507.7
2011732,027.8527.8
2010872,385.5579.5
CSVHow to readBreak and enter: the law →

Fraud and cybercrime

Fraud and identity crime

Rate per 100,000 people, 2010 to 2025.

19
incidents, 2025
569
per 100,000
02505007501,00020102014201820222025569492
02505007501,000201020132016201920222025569492
  • Inuvik
  • Canada

Share of incidents, 2025

  • Fraud1790%
  • Identity fraud211%
The rate in Inuvik is 16% above Canada (492); Northwest Territories: 707.

Source: Statistics Canada, Table 35-10-0185-01, 2025

DataHide data
Fraud and identity crime
YearIncidentsRate per 100,000Canada rate
202519569.4492.4
202425753.0511.0
202327819.7505.6
202218540.5462.4
202116474.6442.8
202018530.2442.8
201916465.3443.2
201818519.6403.7
201713378.3357.9
20166175.1351.1
20159258.8304.9
20149257.4265.5
20137202.8260.5
201210288.5257.7
201111305.6253.9
201016438.7261.0
CSVHow to readFraud: law and penalties →

Drugs, weapons and driving

Drug offences

Rate per 100,000 people, 2010 to 2025.

74
incidents, 2025
2,218
per 100,000
↓ 47.4%
vs 2024
02,0004,0006,000201020142018202220252,218144
02,0004,0006,0002010201320162019202220252,218144
  • Inuvik
  • Canada

Share of incidents, 2025

  • Cocaine trafficking6791%
  • Other drug trafficking11%
  • Possession and other68%
The rate in Inuvik is 15 times the Canada rate (144); Northwest Territories: 2,372.

Source: Statistics Canada, Table 35-10-0185-01, 2025

DataHide data
Drug offences
YearIncidentsRate per 100,000Canada rate
2025742,217.6143.6
20241404,216.9129.8
2023792,398.3113.2
2022361,081.1137.1
2021361,067.9163.2
2020341,001.5177.5
2019822,384.4185.9
201820577.4229.1
201726756.7254.4
201624700.5267.3
2015381,092.6279.6
2014471,344.0294.9
2013401,159.1311.0
2012401,154.1317.1
2011551,527.8330.1
2010391,069.4321.2
CSVHow to readDrug charges: the law →

Impaired driving

Rate per 100,000 people, 2010 to 2025.

82
incidents, 2025
2,457
per 100,000
↓ 25.8%
vs 2024
02,0004,0006,000201020142018202220252,457162
02,0004,0006,0002010201320162019202220252,457162
  • Inuvik
  • Canada

Share of incidents, 2025

  • Impaired by alcohol7693%
  • Drugs and other67%
The rate in Inuvik is 15 times the Canada rate (162); Northwest Territories: 2,163.

Source: Statistics Canada, Table 35-10-0185-01, 2025

DataHide data
Impaired driving
YearIncidentsRate per 100,000Canada rate
2025822,457.3161.8
20241103,313.3165.9
20231634,948.4179.1
2022952,852.9181.6
20211364,034.4187.8
20201494,388.8204.7
20191363,954.6228.1
2018752,165.1191.1
2017882,561.1189.1
2016611,780.5197.5
2015431,236.3201.3
201419543.3210.5
201323666.5221.1
2012561,615.7242.4
2011381,055.6261.0
2010491,343.6256.5
CSVHow to readImpaired driving: the law →

Weapons offences

Rate per 100,000 people, 2010 to 2025.

18
incidents, 2025
539
per 100,000
02004006002010201420182022202553956
020040060020102013201620192022202553956
  • Inuvik
  • Canada

Share of incidents, 2025

  • Possession of weapons1583%
  • Unsafe storage211%
  • Other weapons offences16%

Also reported (counted under other categories): firearms act 4, discharging a firearm 2.

The rate in Inuvik is 9.7 times the Canada rate (56); Northwest Territories: 248.

Source: Statistics Canada, Table 35-10-0185-01, 2025

DataHide data
Weapons offences
YearIncidentsRate per 100,000Canada rate
202518539.455.7
20248241.057.0
202312364.357.4
2022390.152.9
20210052.5
2020388.451.4
2019258.249.8
20186173.244.8
20176174.643.4
20167204.342.2
20154115.040.7
2014385.839.3
2013129.039.1
20120040.3
20114111.140.8
20106164.544.2
CSVHow to readWeapons charges: the law →

Community profile

Community profile

2021 Census of Population, Inuvik, Town (T).

  • 3,137

    population

  • -3.3%

    growth 2016–2021

  • 34.8

    median age

  • $119,000

    median household income

  • 8.7%

    unemployment

  • 8.9%

    low income

  • $1,332

    avg. monthly rent

Source: Statistics Canada, Census of Population, 2021

DataHide data
Community profile
Census figureValue
Median Age34.8
Population Change (2016–2021)-3.3%
Low Income Prevalence (LIM-AT)8.9%
Median Household Income$119,000
Employment Rate67.3%
Unemployment Rate8.7%
Avg. Monthly Rent$1,332
Median Dwelling Value$300,000
CSV

Offences with few reports in Inuvik

Fewer than 10 incidents in the year: too few for a reliable trend or rate.

Offence20252024
Motor vehicle theft914

Source: Statistics Canada, Table 35-10-0185-01

Inuvik skyline
Inuvik flag

Inuvik

Northwest Territories, Canada

Population

3,137

Established

1954

Wikipedia

About Inuvik

Inuvik is the only town in the Inuvik Region, and the third largest community in Canada's Northwest Territories. Located in the Beaufort Delta Region, it serves as the region's administrative and service centre. Inuvik is home to federal, territorial, and Indigenous government offices, along with a regional hospital and airport.

Climate & Weather

Annual historical averages

July High
11°C
Jan Low
-28.8°C
Annual Rain
187 mm
Annual Snow
91 cm

📰 Inuvik & Northwest Territories Crime News

7 ARTICLES
View All News →

November 18, 2026

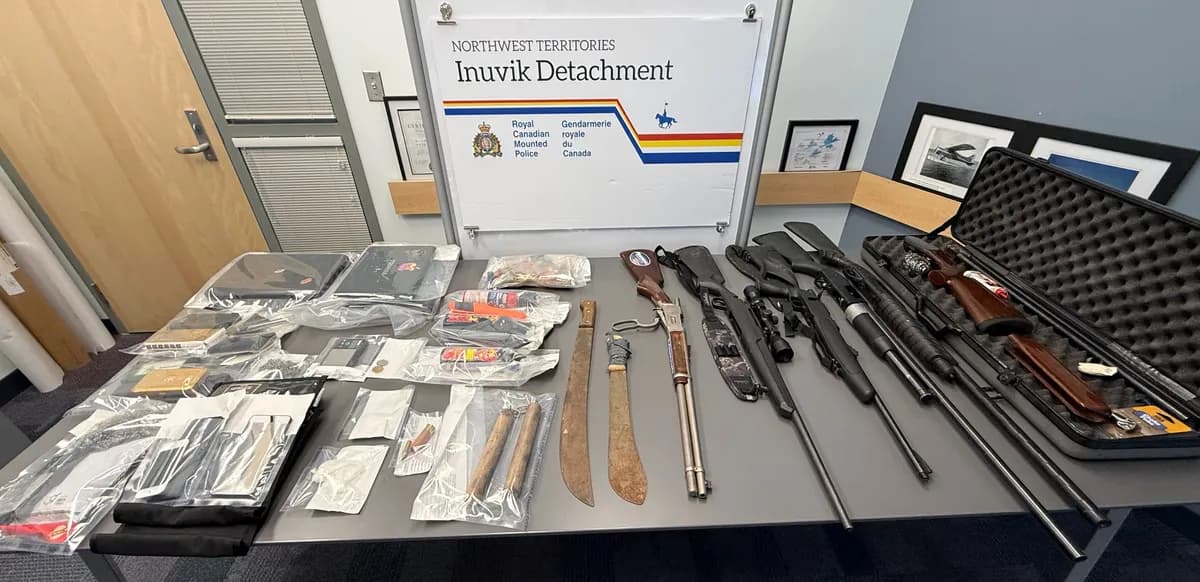
Delta Jasmine Cardinal Charged in Inuvik After 6 Firearms Seized

Three Inuvik residents face firearms charges after RCMP seized six firearms, other weapons and suspected drugs at an Alder Drive residence.…

InuvikNorthwest Territories
Read Article→

May 12, 2026

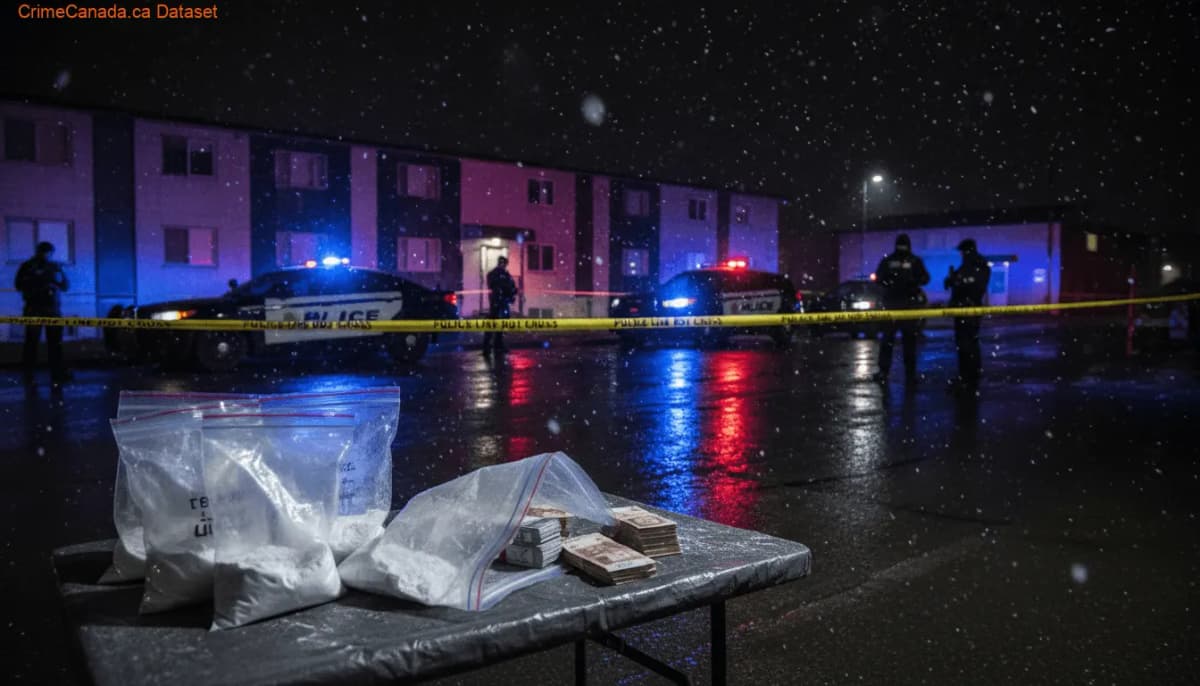
Inuvik RCMP Drug Warrant Leads to Charges and Cash Seizure

Inuvik RCMP executed a drug search warrant on Bompas Street, seizing suspected crack-cocaine and over $8,000 cash. Two adults from Ontario a…

InuvikNorthwest Territories
Read Article→

November 18, 2026

Rayon Klosteren Charged With Trafficking, Weapons Offences in Fort Providence

Fort Providence RCMP charged Rayon Klosteren after a report of threats with a weapon. Police said they seized a shotgun, knives, drug paraph…

Fort ProvidenceNorthwest Territories
Read Article→
More Across Canada

November 17, 2026

Brantford Police Seek Witnesses After Pedestrian, 63, Seriously Injured

A 63-year-old pedestrian was taken to hospital with life-threatening injuries after a coll…

BrantfordOntario
Read Article→

November 18, 2026

3 Drivers Suspended After Virden RCMP Stops in Virden and Reston

Three drivers received licence suspensions after traffic stops in Virden and Reston on Nov…

Manitoba
Read Article→

November 18, 2026

Matthew Alister MacRae-Scanlan Charged in Pictou Drug Trafficking Case

A Pictou man faces drug trafficking charges after police seized two packages and arrested …

PictouNova Scotia
Read Article→

November 17, 2026

Kimmirut Collision Kills 2 Children, Third in Stable Condition

Two children died after a collision involving a water truck in Kimmirut, the RCMP said. A …

KimmirutNunavut
Read Article→

References & Sources

Wikipedia

General information about Inuvik

View source

Statistics Canada

Crime statistics, population & census data

View source

Crime data sourced from the Uniform Crime Reporting (UCR) Survey via Statistics Canada. Last updated for the most recent available reference year.

Related

Crime statistics

Northwest Territories

  • Northwest Territories crime statistics
  • Rankings in Northwest Territories
  • Crime rate by province

News and alerts

News from Northwest Territories

  • Northwest Territories crime news
  • Missing persons
  • Wanted by police

Legal guides

Legal guides

  • Criminal offences explained
  • Your rights and the courts

SourcesStatistics Canada

MethodologyEditorial policyCorrections

Report a problem with this page

A mistake, a photo to remove, a person who was found, a publication ban? Tell us. If someone is in danger, call 911.

We use your email only to answer this report.

Stay Updated

Get weekly crime data insights for Canada.

Crime Canada

Crime news, police alerts and official crime statistics from across Canada.

Report a crime: call 911 in an emergency, or your local police non-emergency line.

Newsroom and corrections: [email protected] · +1 778-900-3008 · Contact

North Vancouver, BC V7M 2J7

Coverage+
  • News
  • Police alerts
  • Missing persons
  • Wanted persons
  • Jails and prisons
  • Criminal courts
  • Legal guides
  • Data and insights

Coverage

  • News
  • Police alerts
  • Missing persons
  • Wanted persons
  • Jails and prisons
  • Criminal courts
  • Legal guides
  • Data and insights
Crime statistics+
  • Statistics dashboard
  • Crime rate by province
  • Safest cities
  • Compare cities
  • Crime map
  • Methodology and sources
  • Media and data reuse

Crime statistics

  • Statistics dashboard
  • Crime rate by province
  • Safest cities
  • Compare cities
  • Crime map
  • Methodology and sources
  • Media and data reuse
Legal help+
  • Free legal consultation
  • Lawyers by city
  • Offence guides
  • Your rights and the courts
  • Understanding crime data

Legal help

  • Free legal consultation
  • Lawyers by city
  • Offence guides
  • Your rights and the courts
  • Understanding crime data
Crime Canada+
  • About
  • Contact and tips
  • For lawyers
  • Editorial policy
  • Advertise
  • Privacy policy
  • Terms of use

Crime Canada

  • About
  • Contact and tips
  • For lawyers
  • Editorial policy
  • Advertise
  • Privacy policy
  • Terms of use
Major citiesTorontoMontréalVancouverCalgaryEdmontonOttawa-GatineauWinnipegQuébec CityHamiltonKitchener-WaterlooHalifaxSaskatoonReginaVictoria
By provinceBritish ColumbiaAlbertaSaskatchewanManitobaOntarioQuebecNew BrunswickNova ScotiaPrince Edward IslandNewfoundland and LabradorYukonNorthwest TerritoriesNunavut

© 2026 Crime Canada · Charges are allegations. Everyone is presumed innocent until proven guilty.

Data: Statistics Canada. Not affiliated with any government agency.

Nearby Areas

14 locations

Aklavik

Municipality
60km

Déline

Municipality
100km

Fort Good Hope

Municipality
100km

Fort Liard

Municipality
100km

Fort Resolution

Municipality
100km

Fort Smith

Municipality
100km

Kakisa

Municipality
100km

Paulatuk

Municipality
100km

Region 1, Unorganized

Municipality
100km