
Crime Canada

Latest

  • Front page
  • All news
  • Data and insights

News by province

  • British Columbia
  • Alberta
  • Saskatchewan
  • Manitoba
  • Ontario
  • Quebec
  • New Brunswick
  • Nova Scotia
  • Prince Edward Island
  • Newfoundland and Labrador
  • Yukon
  • Northwest Territories
  • Nunavut

Police appeals

  • All alerts
  • Missing persons
  • Wanted persons

Explore the data

  • Statistics dashboard
  • Canada overview
  • Crime rate by province
  • Compare cities
  • Metro areas
  • Police areas
  • Crime map

Rankings and reports

  • Safest cities
  • Most dangerous cities
  • Crime Severity Index
  • Crime trends
  • Biggest changes this year
  • Property vs violent crime
  • Is Canada safe?
  • Methodology and sources

By province

  • British Columbia
  • Alberta
  • Saskatchewan
  • Manitoba
  • Ontario
  • Quebec
  • New Brunswick
  • Nova Scotia
  • Prince Edward Island
  • Newfoundland and Labrador
  • Yukon
  • Northwest Territories
  • Nunavut

Know your options

  • Free consultation
  • Find a criminal lawyer
  • Offence guides
  • Your rights and the courts
  • Find your court date
  • Bail, records and pardons
  • Jails and prisons
  • Understanding crime data
Get helpFree consultation
Language
News

Latest

  • Front page
  • All news
  • Data and insights

News by province

  • British Columbia
  • Alberta
  • Saskatchewan
  • Manitoba
  • Ontario
  • Quebec
  • New Brunswick
  • Nova Scotia
  • Prince Edward Island
  • Newfoundland and Labrador
  • Yukon
  • Northwest Territories
  • Nunavut
Alerts

Police appeals

  • All alerts
  • Missing persons
  • Wanted persons
Crime statistics

Explore the data

  • Statistics dashboard
  • Canada overview
  • Crime rate by province
  • Compare cities
  • Metro areas
  • Police areas
  • Crime map

Rankings and reports

  • Safest cities
  • Most dangerous cities
  • Crime Severity Index
  • Crime trends
  • Biggest changes this year
  • Property vs violent crime
  • Is Canada safe?
  • Methodology and sources

By province

  • British Columbia
  • Alberta
  • Saskatchewan
  • Manitoba
  • Ontario
  • Quebec
  • New Brunswick
  • Nova Scotia
  • Prince Edward Island
  • Newfoundland and Labrador
  • Yukon
  • Northwest Territories
  • Nunavut
Legal help

Know your options

  • Free consultation
  • Find a criminal lawyer
  • Offence guides
  • Your rights and the courts
  • Find your court date
  • Bail, records and pardons
  • Jails and prisons
  • Understanding crime data
Free legal consultation
Crime CanadaStatistics DashboardPolice AreasMetro AreasLearn
  1. Home
  2. /Canada
  3. /British Columbia
  4. /Victoria

Metro area · British Columbia

Victoria crime statistics

Crime statistics and police areas for Victoria, British Columbia.

Updated October 26, 2026·Data year 2025·Source: Statistics Canada, police-reported crime·Français

Victoria crime statistics, 2025

Key takeaway

In 2025, police reported 27,789 incidents in Victoria, +8.1% from 2024. Its Crime Severity Index was 74.6, against 75.0 for Canada. Police cleared 31.0% of incidents.

Police-reported incidents

27,789

↑ +8.1% vs previous year

Source: Statistics Canada, Table 35-10-0177-01, 2025

How to read this

Crime Severity Index

74.6

↑ +4.8% vs previous year

Source: Statistics Canada, Table 35-10-0026-01, 2025

How to read this

Violent Crime Severity Index

85.4

↑ +5.5% vs previous year

Source: Statistics Canada, Table 35-10-0026-01, 2025

How to read this

Incidents cleared

31.0%

Source: Statistics Canada, Table 35-10-0177-01, 2025

How to read this

Crime Severity Index, Canada

75.0

Source: Statistics Canada, Table 35-10-0026-01, 2025

How to read this

Police-reported incidents in Victoria, 1998 to 2025

All violations: Criminal Code, traffic and other federal laws.

010K20K30K40K1998200520122019202528K
  • Victoria
010,00020,00030,00040,0001998200320082013201820232025Victoria 27,789
Source: Statistics Canada, Table 35-10-0177-01
Show the dataHide the data
Police-reported incidents in Victoria, 1998 to 2025
YearIncidents
199838,821
199939,764
200035,450
200134,818
200234,478
200337,157
200436,034
200535,743
200637,021
200734,398
200832,898
200932,160
201031,184
201126,764
201225,140
201322,135
201422,881
201524,852
201623,457
201723,050
201824,953
201928,402
202027,360
202126,177
202226,054
202326,787
202425,716
202527,789
Download CSV
Embed this chart

Crime Severity Index, Victoria and Canada

Weighted by the seriousness of each offence. Canada in 2006 = 100.

50751001251501998200520122019202575.074.6
  • Victoria
  • Canada
50751001251501998200320082013201820232025Canada 75.0Victoria 74.6
Source: Statistics Canada, Table 35-10-0026-01
Show the dataHide the data
Crime Severity Index, Victoria and Canada
YearVictoriaCanada
1998145.5118.8
1999141.8111.2
2000123.1106.7
2001117.3105.3
2002113.5104.1
2003113.7106.8
2004116.2104.1
2005108.1101.3
2006117.0100
2007107.995.3
2008103.390.6
200993.287.8
201087.382.9
201172.977.6
201270.375.5
201357.868.9
201460.966.9
201570.270.4
201662.172.0
201760.473.6
201863.775.6
201973.779.7
202075.973.9
202172.774.9
202274.978.8
202380.081.2
202471.278.8
202574.675.0
Download CSV

Most reported offences in Victoria, 2025

  • Mischief3,280
  • Theft $5,000 or under2,787
  • Assault, level 12,672
  • Shoplifting $5,000 or under2,654
  • Fraud2,012
  • Disturb the peace1,458
  • Theft $5,000 or under from a motor vehicle1,235
  • Uttering threats1,216
  • Breaking and entering855
  • Fail to comply with order820
Source: Statistics Canada, Table 35-10-0177-01, 2025
Show the dataHide the data
Most reported offences in Victoria, 2025
OffenceIncidents
Mischief3,280
Theft $5,000 or under2,787
Assault, level 12,672
Shoplifting $5,000 or under2,654
Fraud2,012
Disturb the peace1,458
Theft $5,000 or under from a motor vehicle1,235
Uttering threats1,216
Breaking and entering855
Fail to comply with order820
Download CSV

Types of crime in Victoria, 2025

Share of Criminal Code incidents, excluding traffic.

  • Property crime55.4 %
  • Violent crime27.6 %
  • Other Criminal Code17.0 %
Source: Statistics Canada, Table 35-10-0177-01, 2025
Show the dataHide the data
Types of crime in Victoria, 2025
TypeIncidents%
Property crime13,78255.4
Violent crime6,86427.6
Other Criminal Code4,23117
Download CSV

Every reported offence

The most reported offences in Victoria, 1998 to 2025

Police-reported incidents per year.

02,0004,0006,0008,000199820052012201920253,2802,7872,6722,654
  • Mischief
  • Theft $5,000 or under
  • Assault, level 1
  • Shoplifting $5,000 or under
02,0004,0006,0008,0001998200320082013201820232025Mischief 3,280Theft $5,000 or under 2,787Assault, level 1 2,672Shoplifting $5,000 or under 2,654
Source: Statistics Canada, Table 35-10-0177-01
Show the dataHide the data
The most reported offences in Victoria, 1998 to 2025
YearMischiefTheft $5,000 or underAssault, level 1Shoplifting $5,000 or under
19985,3435,1792,7252,408
19995,4855,5432,6402,262
20005,3715,0462,2982,010
20015,1604,8592,3941,951
20024,9725,0592,3792,005
20035,4675,3242,4361,821
20045,3616,5921,969282
20055,3936,9001,979394
20065,4704,6191,8071,826
20075,7034,2402,0301,792
20086,1873,6332,1451,652
20095,6233,3932,1491,969
20104,3633,0342,2211,911
20114,1512,7041,8301,801
20123,3782,9571,7611,871
20132,8472,7251,5901,628
20142,7083,0771,5961,540
20152,9233,5031,8871,874
20162,6903,3641,8071,786
20172,6353,1591,7951,668
20182,9573,2721,9292,033
20193,2133,6572,1851,865
20203,3802,9842,0861,478
20213,3592,6582,2641,611
20223,3342,5192,1631,946
20233,4542,5952,2502,051
20243,6292,4812,4462,092
20253,2802,7872,6722,654
Download CSV

Historical Trend by Violation

Victoria crime map →

Charged or under investigation?

Talk to a criminal defence lawyer before you speak to police. Tell us what happened and an independent lawyer will contact you. The first consultation is free and confidential.

Prefer to call? +1 778 900 3008

Crime Canada is not a law firm. We pass your request to an independent criminal defence lawyer, who contacts you directly. General information, not legal advice. How this works

Charged with a crime in Victoria?

Local court process, penalties and how to reach a criminal defence lawyer in Victoria.

  • Criminal defence lawyer in Victoria→
  • Impaired driving (DUI) lawyer in Victoria→
  • Assault lawyer in Victoria→
  • Domestic assault lawyer in Victoria→

More detail

Police & Justice

Weighted Clearance Rate2025

i
26.6%

Statistics Canada's severity-weighted clearance rate: solving serious crimes counts more than solving minor ones, so it can differ from the plain share of incidents cleared.

Unfounded Rate2025

i
4.27%
1,240 unfounded|27,789 total

Percentage of reports deemed baseless or false. Lower rates indicate more reliable reporting and thorough follow-up.

Youth Justice2025

i
35.1%
64.9%
238 Charged
441 Diverted

Balance between formal charges and diversionary programs for youth offenders.

Clearance by Category

i
Violent Crimes40.2%
2,760 Solved6,864 Total
Property Crimes16.0%
2,205 Solved13,782 Total
Other Offences51.2%
2,165 Solved4,231 Total
Overall31.0%
8,616 Solved27,789 Total
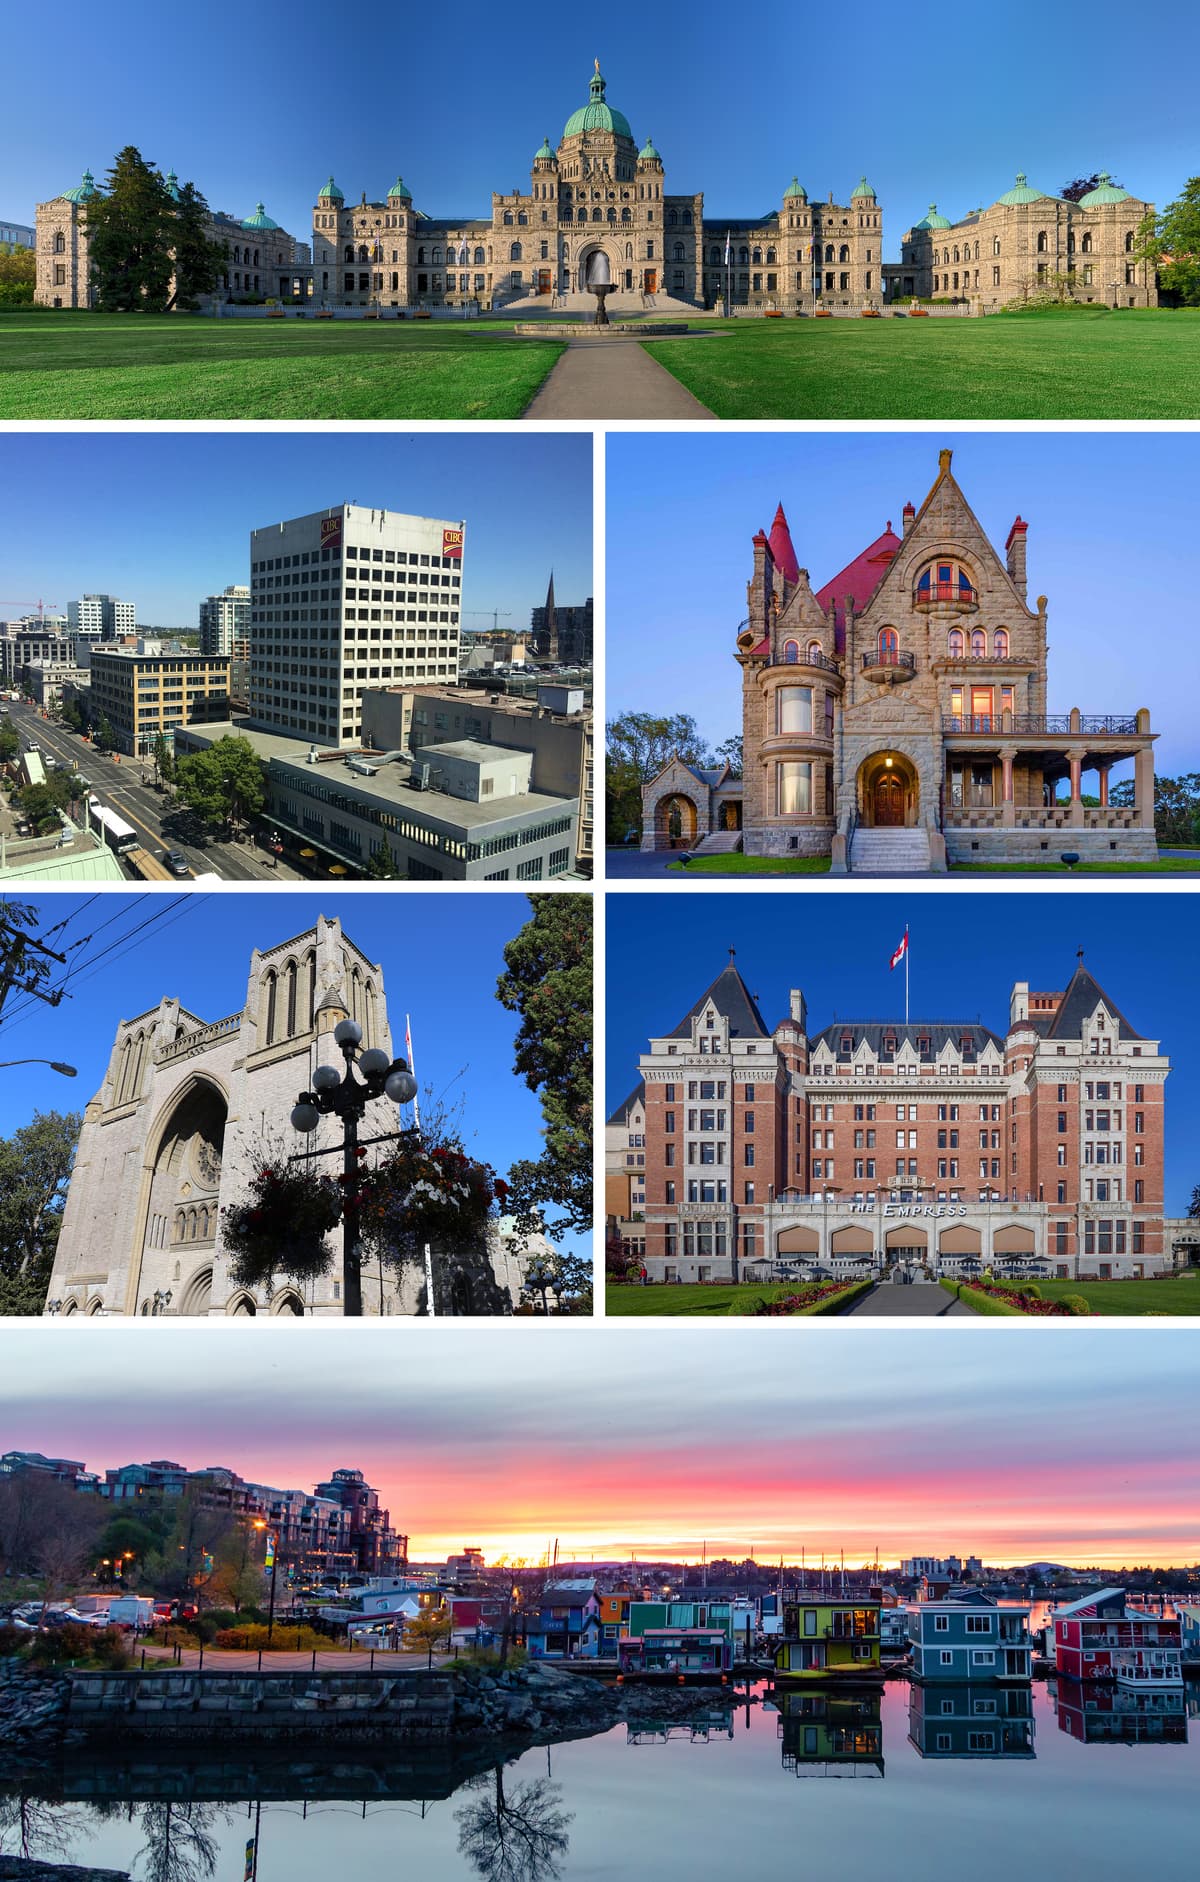
Victoria skyline
Victoria flag

Victoria

British Columbia, Canada

Population

91,867

Established

1862

Wikipedia

About Victoria

Victoria is the capital city of the Canadian province of British Columbia, located on the southern tip of Vancouver Island off Canada's Pacific coast. The city has a population of 91,867, and the Greater Victoria area has a population of 397,237. The city of Victoria is the seventh most densely populated city in Canada with 4,406 inhabitants per square kilometre (11,410/sq mi).

Climate & Weather

Annual historical averages

July High
25.8°C
Jan Low
3.8°C
Annual Rain
798 mm
Annual Snow
0 cm

📰 Victoria & British Columbia Crime News

7 ARTICLES
View All News →

November 2, 2026

Victoria Police Confirm Human Remains Found at Queens Avenue Fire Scene

Victoria police say human remains were found in the 700-block of Queens Avenue after a structure fire on Oct. 24. The BC Coroners Service is…

VictoriaBritish Columbia
Read Article→

July 24, 2026

RCMP and VicPD: Transition in Homicide Investigation Duties

RCMP supports VicPD's move to resume homicide investigations, ensuring seamless safety efforts in BC communities.…

VictoriaBritish Columbia
Read Article→

June 7, 2026

Victoria Strike Force Drug and Weapons Seizure Raises Safety Questions from Gorge Road to Oak Bay

VicPD’s Strike Force seized fentanyl, meth, firearms and cash in a two-day operation spanning Gorge Road East and Oak Bay, highlighting regi…

VictoriaBritish Columbia
Read Article→
More Across Canada

November 2, 2026

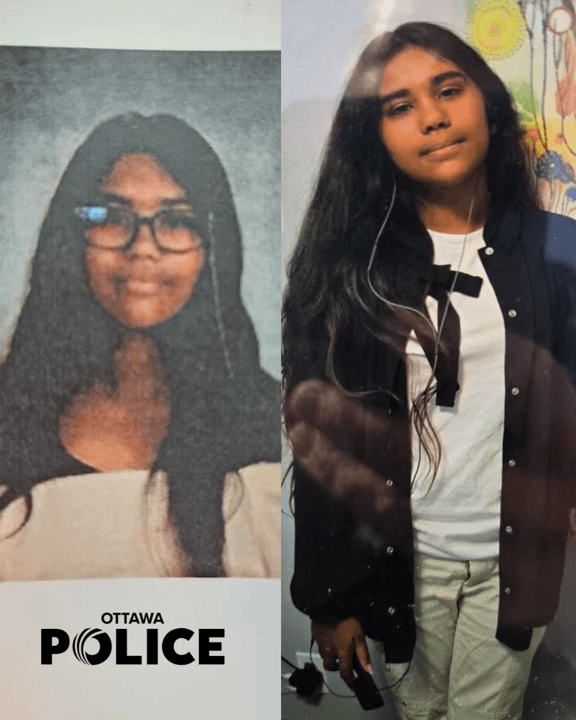
Missing Ottawa 13-Year-Old Lily Brierley Last Seen at Place d'Orléans

Ottawa police are asking for help finding 13-year-old Lily Brierley, last seen Monday morn…

OttawaOntario
Read Article→

November 2, 2026

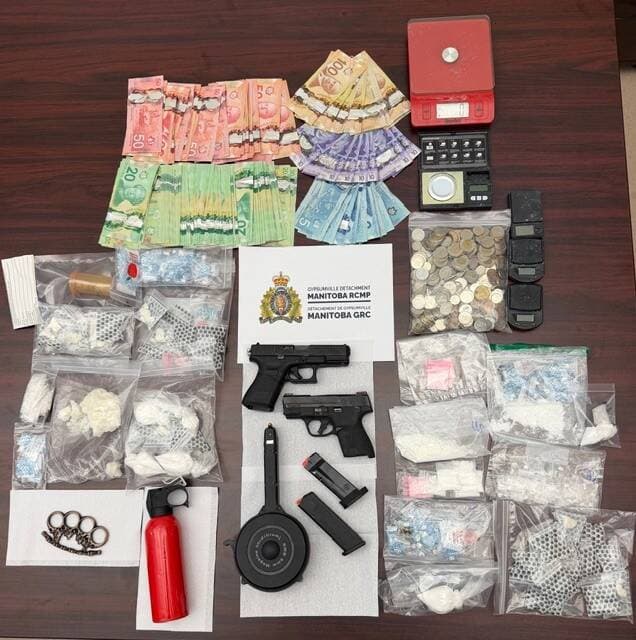
Lake St. Martin First Nation: Cocaine Worth Over $200,000, Two Handguns Seized

Gypsumville RCMP seized more than half a kilo of cocaine, two 9mm handguns and cash in a s…

Lake St. Martin First NationManitoba
Read Article→

November 2, 2026

Man Found Dead After House Fire on Chilliwack's Young Road, RCMP Say

An adult man was found dead inside a home after a fire in the 9800-block of Young Road in …

ChilliwackBritish Columbia
Read Article→

November 2, 2026

High-Risk Offender Kevin Koehler, 62, Released Into Waterloo Region, Police Warn

Waterloo Regional Police say Kevin Koehler, 62, a high-risk offender with a history of vio…

Ontario
Read Article→

References & Sources

Wikipedia

General information about Victoria

View source

Statistics Canada

Crime statistics, population & census data

View source

Crime data sourced from the Uniform Crime Reporting (UCR) Survey via Statistics Canada. Last updated for the most recent available reference year.

Related

Crime statistics

British Columbia

  • British Columbia crime statistics
  • Rankings in British Columbia
  • Crime rate by province

News and alerts

News from British Columbia

  • British Columbia crime news
  • Missing persons
  • Wanted by police

Legal guides

Legal guides

  • Criminal offences explained
  • Your rights and the courts

SourcesStatistics Canada

MethodologyEditorial policyCorrections

Report a problem with this page

A mistake, a photo to remove, a person who was found, a publication ban? Tell us. If someone is in danger, call 911.

We use your email only to answer this report.

Stay Updated

Get weekly crime data insights for Canada.

Crime Canada

Crime news, police alerts and official crime statistics from across Canada.

Report a crime: call 911 in an emergency, or your local police non-emergency line.

Newsroom and corrections: [email protected] · +1 778-900-3008 · Contact

North Vancouver, BC V7M 2J7

Coverage+
  • News
  • Police alerts
  • Missing persons
  • Wanted persons
  • Jails and prisons
  • Criminal courts
  • Legal guides
  • Data and insights

Coverage

  • News
  • Police alerts
  • Missing persons
  • Wanted persons
  • Jails and prisons
  • Criminal courts
  • Legal guides
  • Data and insights
Crime statistics+
  • Statistics dashboard
  • Crime rate by province
  • Safest cities
  • Compare cities
  • Crime map
  • Methodology and sources

Crime statistics

  • Statistics dashboard
  • Crime rate by province
  • Safest cities
  • Compare cities
  • Crime map
  • Methodology and sources
Legal help+
  • Free legal consultation
  • Lawyers by city
  • Offence guides
  • Your rights and the courts
  • Understanding crime data

Legal help

  • Free legal consultation
  • Lawyers by city
  • Offence guides
  • Your rights and the courts
  • Understanding crime data
Crime Canada+
  • About
  • Contact and tips
  • For lawyers
  • Editorial policy
  • Advertise
  • Privacy policy
  • Terms of use

Crime Canada

  • About
  • Contact and tips
  • For lawyers
  • Editorial policy
  • Advertise
  • Privacy policy
  • Terms of use
Major citiesTorontoMontréalVancouverCalgaryEdmontonOttawa-GatineauWinnipegQuébec CityHamiltonKitchener-WaterlooHalifaxSaskatoonReginaVictoria
By provinceBritish ColumbiaAlbertaSaskatchewanManitobaOntarioQuebecNew BrunswickNova ScotiaPrince Edward IslandNewfoundland and LabradorYukonNorthwest TerritoriesNunavut

© 2026 Crime Canada · Charges are allegations. Everyone is presumed innocent until proven guilty.

Data: Statistics Canada. Not affiliated with any government agency.

Hate Crimes

i2025
106↑27.7%vs 2024

Police-reported hate crime incidents in Victoria

Hate crime trend (2014–2025)

64278114201420152016201720182019202020212022202320242025

Click on chart to view sub-categories for that year

By Motivation

Statistics Canada publishes only the total for this area, not the motivations. The breakdown by motivation is available for provinces and for Canada.

In 2025, police in Victoria reported 106 hate crimes. That is 27.7% more than in 2024.

Source: Statistics Canada, Table 35-10-0066-01. How we use this data

Homicides

2025i
4↑100.0%vs 2024

Homicide victims in Victoria

(0.90 per 100,000)

Homicide trend (1981–2025)

04812198119902000201020202025

Click on chart to view methods breakdown for that year

By Method

4 victims(+100.0%)Method shares are for all of Canada (not published for Victoria)
🔫Shooting
32.9%
🔪Stabbing
30.5%
👊Beating
20.2%
📋Other methods used
5.1%
⛓️Strangulation
4.9%
❓Methods used unknown
4.6%
🔥Fire (burns or suffocation)
1.8%
Homicide rate:0.90 per 100,000

In 2025, Victoria recorded 4 homicide victims. That is 100% more than in 2024. Across Canada, the most common method was Shooting (32.9% of victims). The homicide rate was 0.90 per 100,000 people.

Source: Statistics Canada, Homicide Survey, Tables 35-10-0068-01, 35-10-0069-01, 35-10-0071-01. How we use this data

Impaired Driving

i2025
997↓3.1%vs 2024

Impaired driving incidents in Victoria

(224.0 per 100,000)

Impaired driving trend (1998–2025)

5588561,1541,4521998200020052010201520202025

Click on chart to view breakdown for that year

By Type

997 incidents(-3.1%)
🍺Impaired by alcohol
73773.9%
🏥Causing bodily harm
40.4%
•Other
25625.7%

89

Total Charged

88

Adults Charged

1

Youth Charged

Impaired driving rate:224.0 per 100,000

In 2025, police in Victoria reported 997 impaired driving incidents. That is 3.1% fewer than in 2024. The most common type was Impaired by alcohol (737 incidents). The rate was 224.0 per 100,000 people. 89 people were charged: 88 adults and 1 youth.

Source: Statistics Canada, Table 35-10-0177-01. How we use this data

🏘️

Socioeconomic Profile

iCensus 2021

397,237

Population

$75,500

Median Income

6.9%

Unemployment

62.1%

Homeownership

👥 Population

44.8

Median Age

8.0%

Growth (2016–2021)

💰 Income

$85,000

Median Household Income

$107,000

Average Household Income

8.9%

Low Income Prevalence (LIM-AT)

💼 Labour

63.5%

Participation Rate

59.2%

Employment Rate

6.9%

Unemployment Rate

🎓 Education (25–64)

No Certificate
35,000
High School
94,050
Postsecondary
208,990
Bachelor's+
113,645

🏠 Housing

$945,000

Avg. Dwelling Value

$1,452

Avg. Monthly Rent

$1,670

Avg. Mortgage Cost

🌍 Diversity

64,775

Visible Minorities

73,345

Immigrants

19,460

Indigenous Identity

According to the 2021 Census, Victoria had a population of 397,237 (+8.0% change from 2016) with a median age of 44.8. The median after-tax household income was $75,500, and the unemployment rate was 6.9%. Homeownership rate was 62.1% with an average dwelling value of $945,000.

Source: Statistics Canada, Census of Population, 2021. How we use this data

⚖️

Adult vs Youth Charged

i2025

3,382

Adults Charged

-2.3% YoY

238

Youth Charged

+8.7% YoY

6.6%

Youth Share

3,620

Total Charged

Adult rate: 889.0 per 100,000

Youth rate: 983.1 per 100,000

02K4K6K05001K2K2K1998200320082013201820232025Adults ▼▼ Youth

2025

Adults: 3,382

Youth: 238

Adults (left axis) Youth (right axis)

Dual-axis: each line has its own scale · Click to view year details

Adult Δ (1998–2025)

-49.0%

Youth Δ (1998–2025)

-87.0%

In 2025, police in Victoria charged 3,382 adults and 238 youth. Youth were 6.6% of the people charged. Since 1998, charges against youth changed by -87.0% and charges against adults by -49.0%.

Source: Statistics Canada, Table 35-10-0177-01. How we use this data

🖥️Cybercrimei
2025
420.3per 100,000 population
+551%
Since 2014
2023
Peak Year
593.7
Peak Rate
12
Years of Data
02004006002025: 420.3 / 100K201420152016201720182019202020212022202320242025
Rate per 100KPeak Year

In 2025, cybercrime in Victoria reached 420.3 per 100,000 people. The peak was 593.7 in 2023.

Source: Statistics Canada, Table 35-10-0002-01. Click chart to select year. How we use this data

🚗Motor Vehicle Theft🔵 VERY LOWi
2025
315incidents
70.8 per 100,000 population
-77%
Since 1998
15.2%
Solved Rate
1999
Peak Year
1.3%
CSI Impact
Persons Charged24
👤 Adults: 20 (83%)🧑 Youth: 4 (17%)
+ 4 youth diverted (not charged)
How Cases Are Cleared
Cleared by Charge26 (54%)
Cleared Otherwise22 (46%)
"Cleared otherwise" includes cases where charges cannot be laid (e.g., suspect deceased, diplomatic immunity, victim declines).
Unfounded Reports
53
14.4%
of all reported MVT
vs National Average▼ 65% below
This Location70.8
National Avg200.8
100200300400Natl2025: 70.8 / 100K (315)1998200120042007201020132016201920222025
Rate per 100KNational AvgPeak Year (1999)

In 2025, police in Victoria reported 315 motor vehicle thefts. That is 70.8 per 100,000 people. The rate peaked at 390.5 in 1999. 15.2% of cases were cleared.

Source: Statistics Canada, Table 35-10-0177-01. Click chart to select year. How we use this data

🔫

Firearms & Weapons

i
2025

Incidents

236

▼ 12.3% vs 2024

Rate per 100K

53.0

Breakdown

Possession of weapons
22193.6%
Unsafe storage
135.5%
Other
20.8%
Firearms Act
9related
Pointing a firearm
3related

Related items are counted by Statistics Canada under violent crime or federal statutes, not in the weapons total.

Source: Statistics Canada, Table 35-10-0177-01. How we use this data

💊

Drug Offences

i
2025

Incidents

1,587

▲ 57.6% vs 2024

Rate per 100K

356.5

Breakdown

Other drug trafficking
20713%
Cocaine trafficking
795%
Other
1,30182%

Source: Statistics Canada, Table 35-10-0177-01. How we use this data

🏠

Property Crime

i
2025

Incidents

13,782

▲ 7.2% vs 2024

Rate per 100K

3096.0

Breakdown

Theft under $5K
6,67648.4%
Mischief
3,28223.8%
Break & Enter
8586.2%
Motor vehicle theft
3152.3%
Theft over $5K
2301.7%
Arson
980.7%
Shoplifting $5K+
200.1%
Other
2,30316.7%

Source: Statistics Canada, Table 35-10-0177-01. How we use this data

🔪

Violent Crime

i
2025

Incidents

6,864

▲ 7.9% vs 2024

Rate per 100K

1541.9

Breakdown

Assault Level 1
2,67238.9%
Uttering Threats
1,21617.7%
Assault Level 2
77511.3%
Sexual Assault L1
4126%
Criminal Harassment
3034.4%
Robbery
1812.6%
Assault Level 3
190.3%
Other
1,28618.7%

Source: Statistics Canada, Table 35-10-0177-01. How we use this data

💰

Fraud & Identity Crime

i
2025

Incidents

2,157

▲ 4.2% vs 2024

Rate per 100K

484.5

Breakdown

Fraud
2,01293.3%
Identity Fraud
1326.1%
Identity Theft
130.6%

Source: Statistics Canada, Table 35-10-0177-01. How we use this data

🔞

Sexual Violence

i
2025

Content warning: This section contains data about sexual offences

Total Incidents

646

▲ 2.7% vs 2024

SA L1 Rate / 100K

145.1

Breakdown

Sexual Assault L1
41263.8%
Violations Against Children
18128%
Non-consensual Images
304.6%
Voyeurism
162.5%
Sexual Assault L2
60.9%
Sexual Assault L3
10.2%

Source: Statistics Canada, Table 35-10-0177-01. How we use this data

🏚️

Breaking & Entering

i
2025

Incidents

858

▲ 7.2% vs 2024

Rate per 100K

192.7

Breakdown

Standard B&E
85599.7%
B&E to Steal Firearm
30.3%

Source: Statistics Canada, Table 35-10-0177-01. How we use this data

🍺

Substance-Related Crime

i
2025

Total Incidents

2,584

▲ 26.9% vs 2024

Drug Rate / 100K

356.5

Breakdown

Drug Violations
1,58761.4%
Impaired Driving
99738.6%
Cannabis Possession
00%
Cannabis Trafficking
00%

Source: Statistics Canada, Table 35-10-0177-01. How we use this data

Nearby Areas

15 locations

Highlands

Municipality
3km

Langford

Municipality
7km

View Royal

Municipality
9km

Cowichan Valley A

Municipality
10km

South Saanich 1

Municipality
10km

Colwood

Municipality
11km

Central Saanich

Municipality
12km

Esquimalt

Municipality
12km

New Songhees 1A

Municipality
12km