Crime Canada

Latest

  • Front page
  • All news
  • Data and insights

News by province

  • British Columbia
  • Alberta
  • Saskatchewan
  • Manitoba
  • Ontario
  • Quebec
  • New Brunswick
  • Nova Scotia
  • Prince Edward Island
  • Newfoundland and Labrador
  • Yukon
  • Northwest Territories
  • Nunavut

Police appeals

  • All alerts
  • Missing persons
  • Wanted persons

Explore the data

  • Statistics dashboard
  • Canada overview
  • Crime rate by province
  • Compare cities
  • Metro areas
  • Police areas
  • Crime map

Rankings and reports

  • Safest cities
  • Most dangerous cities
  • Crime Severity Index
  • Crime trends
  • Biggest changes this year
  • Property vs violent crime
  • Is Canada safe?
  • Methodology and sources

By province

  • British Columbia
  • Alberta
  • Saskatchewan
  • Manitoba
  • Ontario
  • Quebec
  • New Brunswick
  • Nova Scotia
  • Prince Edward Island
  • Newfoundland and Labrador
  • Yukon
  • Northwest Territories
  • Nunavut

Know your options

  • Free consultation
  • Find a criminal lawyer
  • Offence guides
  • Your rights and the courts
  • Find your court date
  • Bail, records and pardons
  • Jails and prisons
  • Understanding crime data
Get helpFree consultation
Language
News

Latest

  • Front page
  • All news
  • Data and insights

News by province

  • British Columbia
  • Alberta
  • Saskatchewan
  • Manitoba
  • Ontario
  • Quebec
  • New Brunswick
  • Nova Scotia
  • Prince Edward Island
  • Newfoundland and Labrador
  • Yukon
  • Northwest Territories
  • Nunavut
Alerts

Police appeals

  • All alerts
  • Missing persons
  • Wanted persons
Crime statistics

Explore the data

  • Statistics dashboard
  • Canada overview
  • Crime rate by province
  • Compare cities
  • Metro areas
  • Police areas
  • Crime map

Rankings and reports

  • Safest cities
  • Most dangerous cities
  • Crime Severity Index
  • Crime trends
  • Biggest changes this year
  • Property vs violent crime
  • Is Canada safe?
  • Methodology and sources

By province

  • British Columbia
  • Alberta
  • Saskatchewan
  • Manitoba
  • Ontario
  • Quebec
  • New Brunswick
  • Nova Scotia
  • Prince Edward Island
  • Newfoundland and Labrador
  • Yukon
  • Northwest Territories
  • Nunavut
Legal help

Know your options

  • Free consultation
  • Find a criminal lawyer
  • Offence guides
  • Your rights and the courts
  • Find your court date
  • Bail, records and pardons
  • Jails and prisons
  • Understanding crime data
Free legal consultation
Crime CanadaStatistics DashboardPolice AreasMetro AreasLearn
  1. Home
  2. /Canada
  3. /Newfoundland and Labrador
  4. /Gander

Town · Newfoundland and Labrador

Gander crime statistics

Crime statistics and police areas for Gander, Newfoundland and Labrador.

Updated October 26, 2026·Data year 2025·Source: Statistics Canada, police-reported crime·Français

These figures are for the Gander RCMP detachment, which polices Gander and the rural area around it.

Gander crime statistics, 2025

Key takeaway

In 2025, police reported 1,117 incidents in Gander, −20.6% from 2024. Police cleared 23.8% of incidents.

Police service reporting these figures: Gander, Newfoundland and Labrador, Royal Canadian Mounted Police, rural

Police-reported incidents

1,117

↓ −20.6% vs previous year

Source: Statistics Canada, Table 35-10-0178-01, 2025

How to read this

Incidents cleared

23.8%

Source: Statistics Canada, Table 35-10-0178-01, 2025

How to read this

Crime Severity Index, Canada

75.0

Source: Statistics Canada, Table 35-10-0026-01, 2025

How to read this

Police-reported incidents in Gander, 1998 to 2025

All violations: Criminal Code, traffic and other federal laws.

01,0002,0003,000199820052012201920251,117
  • Gander
01,0002,0003,0001998200320082013201820232025Gander 1,117
Source: Statistics Canada, Table 35-10-0178-01
Show the dataHide the data
Police-reported incidents in Gander, 1998 to 2025
YearIncidents
19981,962
19992,165
20002,015
20012,237
20022,169
20032,427
20042,208
20051,993
20061,749
20071,816
20081,643
20091,841
20102,120
20111,922
20121,679
20131,729
2014729
2015746
2016754
2017824
2018865
2019998
2020918
2021868
20221,194
20231,345
20241,407
20251,117
Download CSV
Embed this chart

Most reported offences in Gander, 2025

  • Mischief186
  • Assault, level 1102
  • Shoplifting $5,000 or under101
  • Uttering threats89
  • Disturb the peace75
  • Theft $5,000 or under62
  • Fraud47
  • Fail to comply with order46
  • Breaking and entering43
  • Operation while impaired (alcohol)42
Source: Statistics Canada, Table 35-10-0178-01, 2025
Show the dataHide the data
Most reported offences in Gander, 2025
OffenceIncidents
Mischief186
Assault, level 1102
Shoplifting $5,000 or under101
Uttering threats89
Disturb the peace75
Theft $5,000 or under62
Fraud47
Fail to comply with order46
Breaking and entering43
Operation while impaired (alcohol)42
Download CSV

Types of crime in Gander, 2025

Share of Criminal Code incidents, excluding traffic.

  • Property crime49.6 %
  • Violent crime30.0 %
  • Other Criminal Code20.4 %
Source: Statistics Canada, Table 35-10-0178-01, 2025
Show the dataHide the data
Types of crime in Gander, 2025
TypeIncidents%
Property crime47649.6
Violent crime28830
Other Criminal Code19620.4
Download CSV

Every reported offence

The most reported offences in Gander, 1998 to 2025

Police-reported incidents per year.

02004006001998200520122019202518610210189
  • Mischief
  • Assault, level 1
  • Shoplifting $5,000 or under
  • Uttering threats
02004006001998200320082013201820232025Mischief 186Assault, level 1 102Shoplifting $5,000 or under 101Uttering threats 89
Source: Statistics Canada, Table 35-10-0177-01
Show the dataHide the data
The most reported offences in Gander, 1998 to 2025
YearMischiefAssault, level 1Shoplifting $5,000 or underUttering threats
19983071405071
199937217663142
200035820953153
200140620346119
200240422743120
200347424435160
200439222033120
200542320534123
20063541832396
20074601732983
20084031754597
200947319216117
201046021144103
20114762135597
201241023654131
201337615843132
2014165683425
2015182805128
2016185618232
2017205528822
20182304410019
2019187656445
2020224664635
2021235724237
20223159516050
20233169616361
202429310016986
202518610210189
Download CSV

Historical Trend by Violation

Charged or under investigation?

Talk to a criminal defence lawyer before you speak to police. Tell us what happened and an independent lawyer will contact you. The first consultation is free and confidential.

Prefer to call? +1 778 900 3008

Crime Canada is not a law firm. We pass your request to an independent criminal defence lawyer, who contacts you directly. General information, not legal advice. How this works

Charged with a crime in Gander?

Local court process, penalties and how to reach a criminal defence lawyer in Newfoundland and Labrador.

  • Criminal defence lawyer in Newfoundland and Labrador→
  • Impaired driving (DUI) lawyer in Newfoundland and Labrador→
  • Assault lawyer in Newfoundland and Labrador→
  • Domestic assault lawyer in Newfoundland and Labrador→

More detail

  • Police and justice
  • Violent crime
  • Property crime
  • Fraud and cybercrime
  • Drugs, weapons and driving
  • Community profile

Police and justice

Crimes solved and people charged

Crimes solved by police

Share of reported incidents cleared by a charge or otherwise, 2025.

24%
of all incidents solved
11.1%
of reports unfounded

Solved, by type of crime

  • Violent crime39%113 / 288
  • Property crime16%77 / 476
  • Other offences22%44 / 196
Police found 139 of 1,256 reports to be unfounded: no crime happened or was attempted.

Source: Statistics Canada, Tables 35-10-0026-01 and 35-10-0178-01, 2025

DataHide data
Crimes solved by police
TypeIncidentsSolvedSolved (%)
All1,11726623.8
Violent28811339.2
Property4767716.2
Other1964422.4
CSVHow to read

People charged

Adults and youth (12 to 17) charged, 1998 to 2025.

186
adults charged, 2025
5
youth charged
58%
of youth dealt with without a charge
050100150199820052012201920255
0501001501998200320082013201820255
Charges against youth fell 94% since 1998. Youth not charged were dealt with by warnings, cautions or referrals to programs.

Source: Statistics Canada, Table 35-10-0178-01

DataHide data
People charged
YearAdults chargedYouth charged
20251865
20241945
20231717
202215717
20211303
20201663
20192062
201816314
20171874
20162008
20151725
201417512
201345041
201240763
201138866
201045361
200942452
200841369
200739750
200633163
200529271
2004340104
2003414114
2002372116
2001421138
2000439104
1999345114
199840287
CSVHow to read

Violent crime

Assaults, sexual offences, homicide, hate crimes

Violent crime

Rate per 100,000 people, 1998 to 2025.

288
incidents, 2025
2,025
per 100,000
↑ 1.3%
vs 2024
01,0002,0003,000199820052012201920252,0251,443
01,0002,0003,0001998200320082013201820252,0251,443
  • Gander
  • Canada

Share of incidents, 2025

  • Assault, level 110235%
  • Uttering threats8931%
  • Assault, level 2166%
  • Criminal harassment155%
  • Sexual assault, level 1135%
  • Robbery83%
  • Other violent offences4415%
The rate in Gander is 40% above Canada (1,443); Newfoundland and Labrador: 1,838.

Source: Statistics Canada, Table 35-10-0178-01, 2025

DataHide data
Violent crime
YearIncidentsRate per 100,000Canada rate
20252882,024.81,443.3
20242821,998.41,447.8
20232521,814.11,441.8
20222311,683.61,376.9
20211941,416.01,331.1
20201731,266.61,265.0
20191771,306.01,278.5
201893686.41,151.4
2017115853.41,112.7
2016131979.41,076.0
20151461,102.01,070.3
20141361,039.41,044.2
2013425896.11,095.7
20125111,072.51,198.8
2011449938.81,235.7
2010467974.41,291.6
2009461966.21,321.9
2008440927.41,334.3
2007386813.41,353.9
2006420875.31,386.7
2005452929.41,388.9
20044971,008.61,404.2
20035781,168.91,434.8
200248401,440.8
200148201,473.4
200050001,494.2
199946501,440.1
199836501,344.9
CSVHow to readAssault: law and penalties →

Sexual offences

Rate per 100,000 people, 1998 to 2025.

18
incidents, 2025
127
per 100,000
05010015020019982005201220192025133127
050100150200199820032008201320182025133127
  • Gander
  • Canada

Share of incidents, 2025

  • Sexual assault, level 11372%
  • Intimate images shared317%
  • Offences against children211%
The rate in Gander is 5% below Canada (133); Newfoundland and Labrador: 137.

Source: Statistics Canada, Table 35-10-0178-01, 2025

DataHide data
Sexual offences
YearIncidentsRate per 100,000Canada rate
202518126.5133.4
202416113.4134.9
202324172.8133.3
202222160.3134.2
202124175.2132.6
20201287.9113.1
201921155.0118.5
2018859.0107.7
201716118.797.0
2016752.384.4
20151398.176.6
2014645.973.1
20133165.474.4
20122756.776.2
2011336976.5
20103062.677.9
20092960.871.4
20083778.069.8
20072654.867.3
20063062.569.1
20051530.873.1
20043979.272.3
20033672.874.5
200224078.1
200141077.5
200032078.2
199952078.5
199850084.7
CSVHow to readSexual assault: the law →

Property crime

Theft, break-ins, vehicles, mischief

Property crime

Rate per 100,000 people, 1998 to 2025.

476
incidents, 2025
3,346
per 100,000
↓ 34.1%
vs 2024
02,0004,0006,000199820052012201920253,3463,141
02,0004,0006,0001998200320082013201820253,3463,141
  • Gander
  • Canada

Share of incidents, 2025

  • Mischief18639%
  • Theft under $5,00018038%
  • Break and enter449%
  • Motor vehicle theft51%
  • Fraud and other5512%
The rate in Gander is 7% above Canada (3,141); Newfoundland and Labrador: 3,768.

Source: Statistics Canada, Table 35-10-0178-01, 2025

DataHide data
Property crime
YearIncidentsRate per 100,000Canada rate
20254763,346.53,140.6
20247175,081.13,264.6
20237485,384.83,409.6
20226875,006.93,325.0
20214333,160.43,052.5
20204393,2143,084.8
20195313,918.03,509.4
20185834,302.63,347.7
20175083,769.93,265.3
20164383,274.53,238.5
20154403,321.03,231.4
20144123,148.63,099.5
20138931,882.93,154.0
20127901,658.03,438.4
20111,0562,208.13,536.2
20101,0752,243.03,838.1
20099401,970.04,122.0
20088311,751.64,257.9
20071,0002,107.24,524.8
20068951,865.24,809
20051,0412,140.54,883.9
20041,1872,408.95,123.1
20031,2502,527.95,298.5
20021,07405,080.1
20011,12405,124.0
200095905,188.9
19991,16005,344.6
199894705,696.0
CSVHow to readTheft: law and penalties →

Break and enter

Rate per 100,000 people, 1998 to 2025.

44
incidents, 2025
309
per 100,000
↑ 24.7%
vs 2024
05001,0001,50019982005201220192025309264
05001,0001,500199820032008201320182025309264
  • Gander
  • Canada

Share of incidents, 2025

  • Break and enter4398%
  • To steal a firearm12%
The rate in Gander is 17% above Canada (264); Newfoundland and Labrador: 314.

Source: Statistics Canada, Table 35-10-0178-01, 2025

DataHide data
Break and enter
YearIncidentsRate per 100,000Canada rate
202544309.3263.5
202435248.0294.6
202339280.8327.8
202241298.8342.4
202130219.0329.3
202030219.6363.1
201967494.4429.4
201870516.6432.5
201759437.9436.8
201636269.1443.7
201573551.0447.1
201471542.6429.4
2013183385.9446
2012120251.9507.7
2011198414.0527.8
2010225469.5579.5
2009136285.0612.8
2008143301.4634.9
2007210442.5704.0
2006157327.2771.7
2005207425.6810.6
2004308625.1863.7
2003207418.6900.5
20021800878.9
20012150900.9
20001310955.9
199920601,046.1
199817101,163.2
CSVHow to readBreak and enter: the law →

Fraud and cybercrime

Fraud and identity crime

Rate per 100,000 people, 1998 to 2025.

53
incidents, 2025
373
per 100,000
↓ 35.9%
vs 2024
020040060019982005201220192025492373
0200400600199820032008201320182025492373
  • Gander
  • Canada

Share of incidents, 2025

  • Fraud4789%
  • Identity fraud611%
The rate in Gander is 24% below Canada (492); Newfoundland and Labrador: 382.

Source: Statistics Canada, Table 35-10-0178-01, 2025

DataHide data
Fraud and identity crime
YearIncidentsRate per 100,000Canada rate
202553372.6492.4
202482581.1511.0
202368489.5505.6
202252379.0462.4
202145328.4442.8
202050366.1442.8
201944324.7443.2
201836265.7403.7
201743319.1357.9
201644329.0351.1
201516120.8304.9
201428214.0265.5
201351107.5260.5
20123063.0257.7
201155115253.9
20104696.0261.0
200953111.1269.8
20084288.5275.1
20073880.1269.9
20064389.6286.1
20054388.4295.8
200469140.0305.1
200351103.1293.7
2002750292.8
2001850278.8
2000750279.6
1999990297.2
1998940314.4
CSVHow to readFraud: law and penalties →

Drugs, weapons and driving

Drug offences

Rate per 100,000 people, 1998 to 2025.

56
incidents, 2025
394
per 100,000
↑ 68.3%
vs 2024
010020030040019982005201220192025394144
0100200300400199820032008201320182025394144
  • Gander
  • Canada

Share of incidents, 2025

  • Cocaine trafficking2646%
  • Other drug trafficking814%
  • Possession and other2239%
The rate in Gander is 2.7 times the Canada rate (144); Newfoundland and Labrador: 186.

Source: Statistics Canada, Table 35-10-0178-01, 2025

DataHide data
Drug offences
YearIncidentsRate per 100,000Canada rate
202556393.7143.6
202433233.9129.8
202340288.0113.2
202235255.1137.1
202134248.2163.2
202042307.5177.5
201933243.5185.9
201819140.2229.1
201719141254.4
201614104.7267.3
201515113.2279.6
201428214.0294.9
201365137.1311.0
201262130.1317.1
201173152.6330.1
201078162.8321.2
200950104.8291.3
200856118.0307.6
200781170.7307.7
200656116.7295.3
200594193.3290.5
200484170.5305.7
200360121.3274.3
2002650295.9
2001730288.2
2000920287.0
1999790263.6
1998720235.2
CSVHow to readDrug charges: the law →

Impaired driving

Rate per 100,000 people, 1998 to 2025.

82
incidents, 2025
576
per 100,000
↑ 9.9%
vs 2024
020040060019982005201220192025576162
0200400600199820032008201320182025576162
  • Gander
  • Canada

Share of incidents, 2025

  • Impaired by alcohol4251%
  • Drugs and other4049%
The rate in Gander is 3.6 times the Canada rate (162); Newfoundland and Labrador: 364.

Source: Statistics Canada, Table 35-10-0178-01, 2025

DataHide data
Impaired driving
YearIncidentsRate per 100,000Canada rate
202582576.5161.8
202474524.4165.9
202351367.1179.1
202246335.3181.6
202157416.0187.8
202070512.5204.7
201974546228.1
201818132.8191.1
201722163.3189.1
201614104.7197.5
201519143.4201.3
201423175.8210.5
201357120.2221.1
201260125.9242.4
201166138261.0
2010141294.2256.5
2009101211.7262.6
200886181.3254.8
200795200.2241.4
200678162.6233.7
200558119.3243.0
20044897.4251.5
200379159.8245.4
2002720255.3
2001660266.7
2000750258.2
1999980282.9
1998930290.7
CSVHow to readImpaired driving: the law →

Community profile

Community profile

2021 Census of Population, Gander, Town (T).

  • 11,880

    population

  • 1.6%

    growth 2016–2021

  • 45.2

    median age

  • $80,000

    median household income

  • 14.3%

    unemployment

  • 11.4%

    low income

  • $972

    avg. monthly rent

Source: Statistics Canada, Census of Population, 2021

DataHide data
Community profile
Census figureValue
Median Age45.2
Population Change (2016–2021)1.6%
Low Income Prevalence (LIM-AT)11.4%
Median Household Income$80,000
Employment Rate52.3%
Unemployment Rate14.3%
Avg. Monthly Rent$972
Median Dwelling Value$260,000
CSV

Offences with few reports in Gander

Fewer than 10 incidents in the year: too few for a reliable trend or rate.

Offence20252024
Motor vehicle theft514
Weapons offences67

Source: Statistics Canada, Table 35-10-0178-01

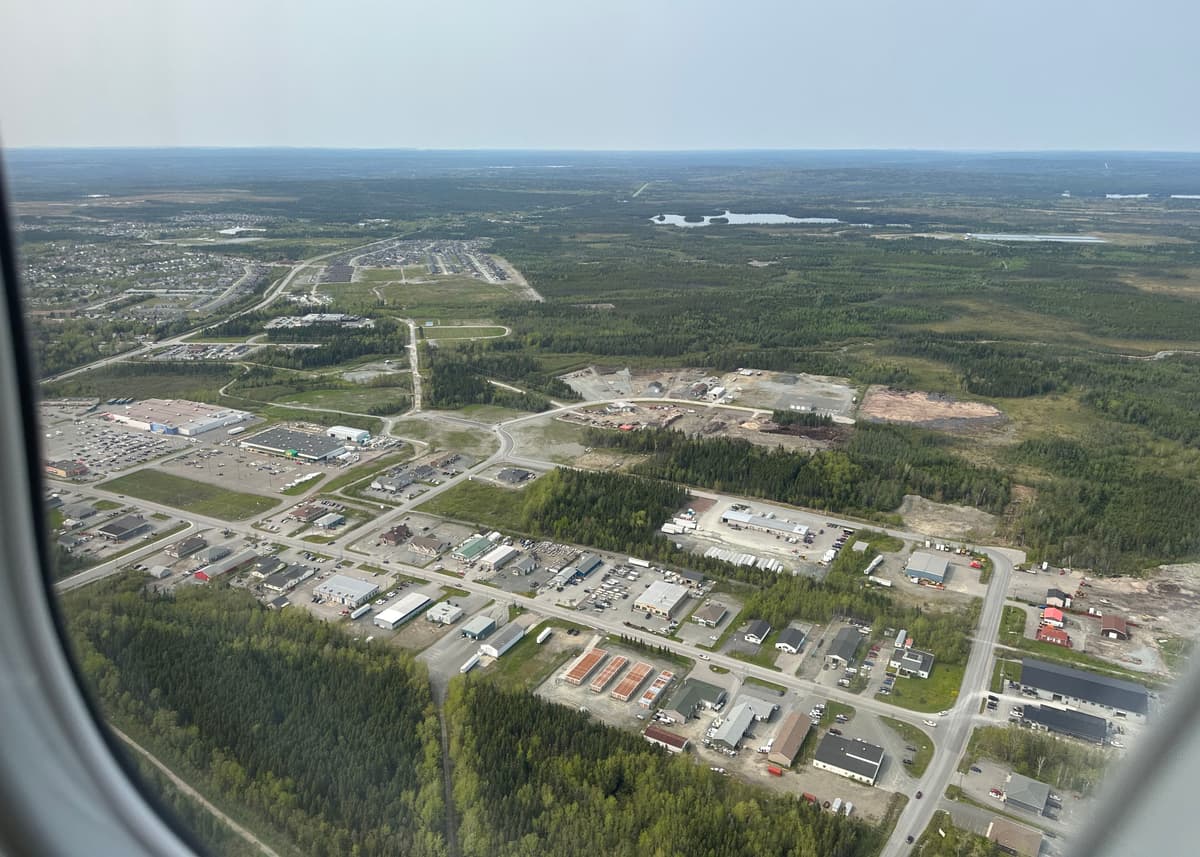
Gander skyline
Gander flag

Gander

Newfoundland and Labrador, Canada

Population

11,880

Established

1936

Wikipedia

About Gander

Gander is a town located in the northeastern part of the island of Newfoundland in the Canadian province of Newfoundland and Labrador, approximately 40 km (25 mi) south of Gander Bay, 100 km (62 mi) south of Twillingate and 90 km (56 mi) east of Grand Falls-Windsor. Located on the northeastern shore of Gander Lake, it is the site of Gander International Airport, once an important refuelling stop for transatlantic aircraft. The airport is still a preferred emergency landing point for aircraft facing on-board medical or security issues.

Climate & Weather

Annual historical averages

July High
24.7°C
Jan Low
-6.2°C
Annual Rain
646 mm
Annual Snow
305 cm

📰 Gander & Newfoundland and Labrador Crime News

7 ARTICLES
View All News →

November 5, 2026

Gander RCMP seek 46-year-old Philip Anstey on arrest warrant

Gander RCMP are asking for help locating Philip Anstey, 46, who is wanted after failing to appear in court. Police believe he is likely in G…

GanderNewfoundland And Labrador
Read Article→

November 4, 2026

Gander RCMP Arrests Man Wanted in Relation to 7 Charges

Gander RCMP arrested Derek Joseph Bennett, 56, during a traffic stop. Police say he was wanted in relation to seven charges and was expected…

GanderNewfoundland And Labrador
Read Article→

November 3, 2026

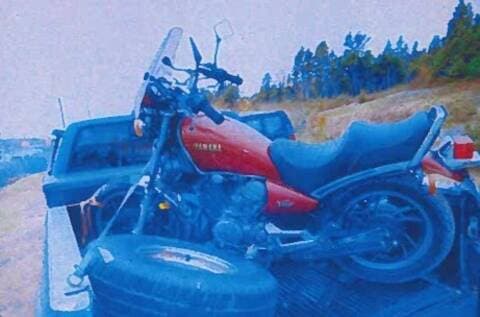
Stolen: Gander RCMP Seek Red 1983 Yamaha Motorcycle Taken in Port Albert

Gander RCMP is asking for help finding a red 1983 Yamaha motorcycle, plate MAB 276, stolen from outside a home in Port Albert.…

GanderNewfoundland And Labrador
Read Article→
More Across Canada

November 6, 2026

Grand Rapids: Semi-truck driver, 31, charged after Highway 6 stop

Grand Rapids RCMP say a semi-truck driver was charged after motorists reported a truck swe…

Grand RapidsManitoba
Read Article→

November 5, 2026

Federal consultant sentenced to 12 months for fraudulent billing

Federal consultant Andrew McDermott received a 12-month conditional sentence after pleadin…

OttawaOntario
Read Article→

November 6, 2026

Waterloo Police Investigate Cameras Stolen From Residence

Several Canon cameras, accessories and security recording equipment were stolen from a uni…

WaterlooOntario
Read Article→

November 5, 2026

Alberta RCMP charge 5 in probe tied to over 80 vehicles worth about $6 million

Five people face charges after an Alberta RCMP investigation linked more than 80 vehicles …

Alberta
Read Article→

References & Sources

Wikipedia

General information about Gander

View source

Statistics Canada

Crime statistics, population & census data

View source

Crime data sourced from the Uniform Crime Reporting (UCR) Survey via Statistics Canada. Last updated for the most recent available reference year.

Related

Crime statistics

Newfoundland and Labrador

  • Newfoundland and Labrador crime statistics
  • Rankings in Newfoundland and Labrador
  • Crime rate by province

News and alerts

News from Newfoundland and Labrador

  • Newfoundland and Labrador crime news
  • Missing persons
  • Wanted by police

Legal guides

Legal guides

  • Criminal offences explained
  • Your rights and the courts

SourcesStatistics Canada

MethodologyEditorial policyCorrections

Report a problem with this page

A mistake, a photo to remove, a person who was found, a publication ban? Tell us. If someone is in danger, call 911.

We use your email only to answer this report.

Stay Updated

Get weekly crime data insights for Canada.

Crime Canada

Crime news, police alerts and official crime statistics from across Canada.

Report a crime: call 911 in an emergency, or your local police non-emergency line.

Newsroom and corrections: [email protected] · +1 778-900-3008 · Contact

North Vancouver, BC V7M 2J7

Coverage+
  • News
  • Police alerts
  • Missing persons
  • Wanted persons
  • Jails and prisons
  • Criminal courts
  • Legal guides
  • Data and insights

Coverage

  • News
  • Police alerts
  • Missing persons
  • Wanted persons
  • Jails and prisons
  • Criminal courts
  • Legal guides
  • Data and insights
Crime statistics+
  • Statistics dashboard
  • Crime rate by province
  • Safest cities
  • Compare cities
  • Crime map
  • Methodology and sources
  • Media and data reuse

Crime statistics

  • Statistics dashboard
  • Crime rate by province
  • Safest cities
  • Compare cities
  • Crime map
  • Methodology and sources
  • Media and data reuse
Legal help+
  • Free legal consultation
  • Lawyers by city
  • Offence guides
  • Your rights and the courts
  • Understanding crime data

Legal help

  • Free legal consultation
  • Lawyers by city
  • Offence guides
  • Your rights and the courts
  • Understanding crime data
Crime Canada+
  • About
  • Contact and tips
  • For lawyers
  • Editorial policy
  • Advertise
  • Privacy policy
  • Terms of use

Crime Canada

  • About
  • Contact and tips
  • For lawyers
  • Editorial policy
  • Advertise
  • Privacy policy
  • Terms of use
Major citiesTorontoMontréalVancouverCalgaryEdmontonOttawa-GatineauWinnipegQuébec CityHamiltonKitchener-WaterlooHalifaxSaskatoonReginaVictoria
By provinceBritish ColumbiaAlbertaSaskatchewanManitobaOntarioQuebecNew BrunswickNova ScotiaPrince Edward IslandNewfoundland and LabradorYukonNorthwest TerritoriesNunavut

© 2026 Crime Canada · Charges are allegations. Everyone is presumed innocent until proven guilty.

Data: Statistics Canada. Not affiliated with any government agency.

Nearby Areas

14 locations

Appleton

Municipality
23km

Division No. 6, Subd. E

Municipality
23km

Glenwood

Municipality
23km

Gambo

Municipality
33km

Lewisporte

Municipality
33km

Norris Arm

Municipality
45km

Division No. 7, Subd. N

Municipality
46km

Peterview

Municipality
51km

Botwood

Municipality
54km